iperf3를 활용하여 간단한 Cilium 성능테스트(feat. kind)
Cilium 성능테스트

이번 포스팅에서는 Kind를 활용하여 Kubernetes 클러스터를 구성하고, Cilium CNI를 적용한 뒤 간단한 TCP, UDP 트래픽 테스트를 진행해보며, Prometheus 쿼리를 통해 지표를 확인해보는 실습을 진행해보도록 하겠습니다.
실습 환경 구성 - Kind로 K8s Cluster 구축
kind config
kind: Cluster
apiVersion: kind.x-k8s.io/v1alpha4
nodes:
- role: control-plane
  extraPortMappings:
  - containerPort: 30000
    hostPort: 30000
  - containerPort: 30001
    hostPort: 30001
  - containerPort: 30002
    hostPort: 30002
  - containerPort: 30003
    hostPort: 30003
  kubeadmConfigPatches: # Prometheus Target connection refused bind-address 설정
  - |
    kind: ClusterConfiguration
    controllerManager:
      extraArgs:
        bind-address: 0.0.0.0
    etcd:
      local:
        extraArgs:
          listen-metrics-urls: http://0.0.0.0:2381
    scheduler:
      extraArgs:
        bind-address: 0.0.0.0
  - |
    kind: KubeProxyConfiguration
    metricsBindAddress: 0.0.0.0
networking:
  disableDefaultCNI: true
  kubeProxyMode: none
  podSubnet: "10.244.0.0/16"   # cluster-cidr
kubeadmConfigPatches:
- |
  kind: ClusterConfiguration
  controllerManager:
    extraArgs:
      allocate-node-cidrs: "true"
      cluster-cidr: "10.244.0.0/16"
      node-cidr-mask-size: "22"
kind로 k8s cluster 생성
kind create cluster --name myk8s --image kindest/node:v1.33.2 --config ./config-kind
위에서 생성한 coinfig-kind 파일을 토대로 kind cluster를 배포해보겠습니다.

cluster 정보 확인
kubectl cluster-info --context kind-myk8s

node 별 PodCIDR 확인
kubectl get nodes -o jsonpath='{.items[*].spec.podCIDR}'
실습 환경 구성 - Cilium CNI 설치
cilium cni 설치
brew install cilium-cli
MacOS기준 위 명령어로 cilium-cli를 설치합니다.
cilium install --version 1.18.1 --set ipam.mode=kubernetes --set ipv4NativeRoutingCIDR=172.20.0.0/16 \
--set routingMode=native --set autoDirectNodeRoutes=true --set endpointRoutes.enabled=true --set directRoutingSkipUnreachable=true \
--set kubeProxyReplacement=true --set bpf.masquerade=true \
--set endpointHealthChecking.enabled=false --set healthChecking=false \
--set hubble.enabled=true --set hubble.relay.enabled=true --set hubble.ui.enabled=true \
--set hubble.ui.service.type=NodePort --set hubble.ui.service.nodePort=30003 \
--set prometheus.enabled=true --set operator.prometheus.enabled=true --set envoy.prometheus.enabled=true --set hubble.metrics.enableOpenMetrics=true \
--set hubble.metrics.enabled="{dns,drop,tcp,flow,port-distribution,icmp,httpV2:exemplars=true;labelsContext=source_ip\,source_namespace\,source_workload\,destination_ip\,destination_namespace\,destination_workload\,traffic_direction}" \
--set debug.enabled=true
그 후 생성된 cluster에 cilium cli를 사용하여 위의 명령어로 Cilium CNI를 설치합니다.

실습 환경 구성 - metric
metric server 설치
helm repo add metrics-server https://kubernetes-sigs.github.io/metrics-server/
helm upgrade --install metrics-server metrics-server/metrics-server --set 'args[0]=--kubelet-insecure-tls' -n kube-system
부하테스트를 위해 관련 메트릭을 살펴보게끔 metric-server를 helm을 통해 설치합니다.

node 및 pod metric 조회
kubectl top node
위 명령어를 통해 Kubernetes 클러스터의 노드 리소스 사용량(CPU, 메모리) 을 조회해보겠습니다.

kubectl top pod -A --sort-by='cpu'
마찬가지로 이번엔 pod의 리소스 사용량을 cpu 기준으로 정렬해서 확인해보겠습니다.

실습 환경 구성 - monitoring 설정
promethues & Grafana 설치
kubectl apply -f https://raw.githubusercontent.com/cilium/cilium/1.18.1/examples/kubernetes/addons/prometheus/monitoring-example.yaml
설치 확인
kubectl get deploy,pod,svc,ep -n cilium-monitoring
위에서 prometheus와 grafana를 설치한 cilium-monitoring namespace의 리소스를 확인해보겠습니다.

nodeport 설정
kubectl patch svc -n cilium-monitoring prometheus -p '{"spec": {"type": "NodePort", "ports": [{"port": 9090, "targetPort": 9090, "nodePort": 30001}]}}'
kubectl patch svc -n cilium-monitoring grafana -p '{"spec": {"type": "NodePort", "ports": [{"port": 3000, "targetPort": 3000, "nodePort": 30002}]}}'
각각 접속할 수 있게 Pormetheus는 30001 port, Grafana는 30002 port로 service type을 NodePort로 설정합니다.
접속 확인
open "http://127.0.0.1:30001"  # prometheus
open "http://127.0.0.1:30002"  # grafana
성능 테스트 실습
Pod 간 트래픽 부하를 발생시켜 대역폭, 지연, 지터(jitter), 패킷 손실률 등을 측정할 수 있는 iperf3 pod를 배포하여 Cilium 환경에서 TCP/UDP 처리량, latency, packet drop 등을 확인해보는 실습을 진행해보겠습니다.
테스트 애플리케이션 배포
apiVersion: apps/v1
kind: Deployment
metadata:
name: iperf3-server
spec:
selector:
matchLabels:
app: iperf3-server
replicas: 1
template:
metadata:
labels:
app: iperf3-server
spec:
containers:
- name: iperf3-server
image: networkstatic/iperf3
args: ["-s"]
ports:
- containerPort: 5201
---
apiVersion: v1
kind: Service
metadata:
name: iperf3-server
spec:
selector:
app: iperf3-server
ports:
- name: tcp-service
protocol: TCP
port: 5201
targetPort: 5201
- name: udp-service
protocol: UDP
port: 5201
targetPort: 5201
type: ClusterIP
---
apiVersion: apps/v1
kind: Deployment
metadata:
name: iperf3-client
spec:
selector:
matchLabels:
app: iperf3-client
replicas: 1
template:
metadata:
labels:
app: iperf3-client
spec:
containers:
- name: iperf3-client
image: networkstatic/iperf3
command: ["sleep"]
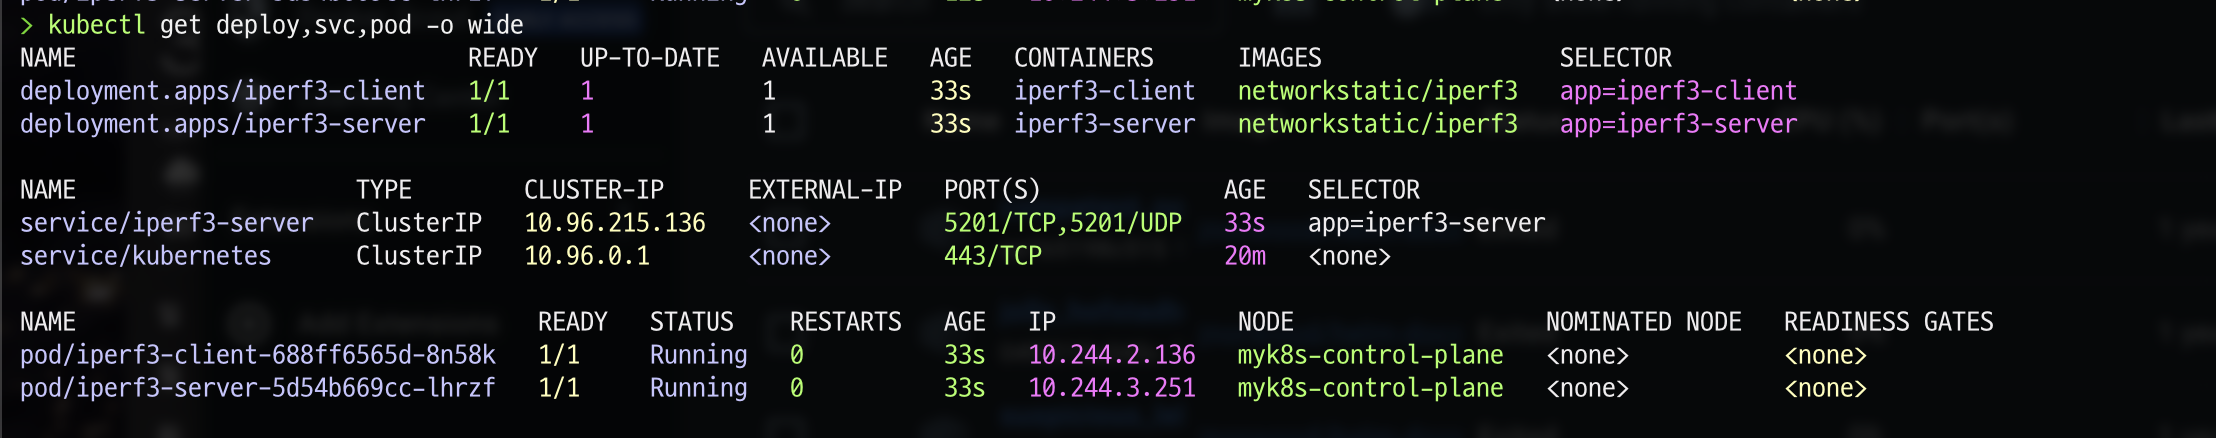
args: ["infinity"]테스트 애플리케이션 확인
kubectl get deploy,svc,pod -o wide
실습 - TCP 통신 트래픽
[터미널1] iperf3-server pod 로그 모니터링
kubectl logs -l app=iperf3-server -f
위 명령어를 통해 iperf3-server pod에 로그를 모니터링 해보겠습니다.
[터미널2] iperf3 클라이언트 Pod에 접속하여 server로 통신
kubectl exec -it deploy/iperf3-client -- iperf3 -c iperf3-server -t 5
위 명령어를 통해 iperf2-cilient pod에 접속하여, iperf3 cli로 iperf3-server로 5초동안 트래픽을 보냅니다.
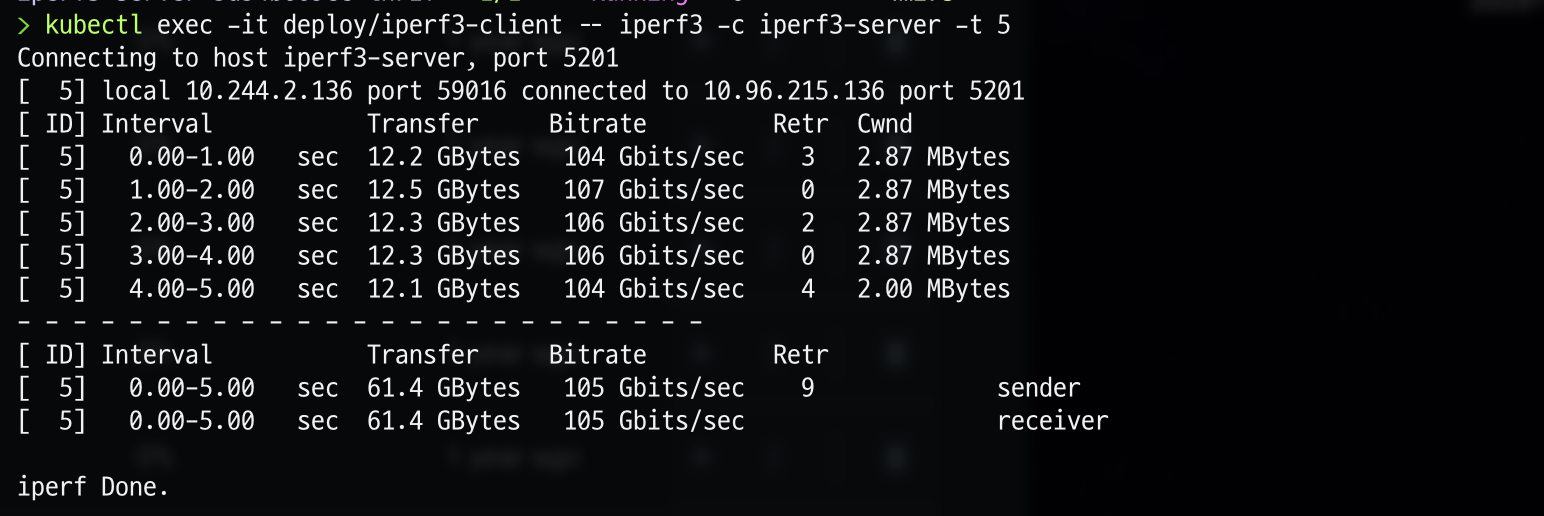
- 평균 전송량 : 61.4 GBytes
- 평균 처리량 : 105 Gbits/sec
- 재전송(Retr): 총 9회 발생(TCP 패킷 일부 재전송)
- 혼잡 윈도우(Cwnd): 약 2.8 MB 수준
즉, Pod 간 네트워크 대역폭은 매우 높게 측정되었고, 소량의 패킷 재전송이 발생했다는 것을 알 수 있습니다.
[터미널1] iperf3-server pod 로그 모니터링

위에서 실행해두었던 iperf3-server pod의 로그 모니터링을 확인해보면, 트래픽이 들어온 내용에 대한 로그를 확인할 수 있습니다.
- 서버 Pod IP: 10.244.3.251:5201
- 클라이언트 Pod IP: 10.244.2.136:59016
- 구간별 처리량: 약 104~107 Gbits/sec
- 총 전송량: 61.4 GBytes
- 평균 처리량: 105 Gbits/sec
즉, 클러스터 내 Pod 간 TCP 대역폭이 약 105 Gbit/s 수준으로 측정되었음을 로그를 통해 알 수 있습니다.
실습 - UDP 트래픽
[터미널1] iperf3-server pod 로그 모니터링
kubectl logs -l app=iperf3-server -f
[터미널2] iperf3 클라이언트 Pod에 접속하여 server로 통신
kubectl exec -it deploy/iperf3-client -- iperf3 -c iperf3-server -u -b 20G
이번에는 iperf3 클라이언트 Pod에서 UDP 트래픽을 초당 20Gbps 속도로 iperf3-server로 보내보겠습니다.

클라이언트 송신 결과는 아래와 같습니다.
- 전송량: 23.3 GBytes
- 평균 전송 속도: 20.0 Gbps
- 패킷 손실 없음 (송신 기준)
서버 수신 결과는 아래와 같습니다.
- 수신량: 22.7 GBytes
- 평균 수신 속도: 19.5 Gbps
- 지터: 0.006 ms
- 손실 패킷: 약 2.6% (19995/762929)
즉, 클라이언트는 20 Gbps 속도로 데이터를 송신했지만 서버는 19.5 Gbps만 수신했고, 2.6% 패킷 손실이 발생했습니다. 지터는 매우 낮은 것으로 보아 안정적인 UDP 처리였음을 알 수 있습니다.
[터미널1] iperf3-server pod 로그 모니터링

이제 서버측 로그를 토대로 결과를 살펴보겠습니다.
- 구간별 수신 속도: 약 19.1 ~ 19.8 Gbps
- 수신 데이터: 22.7 GBytes
- 평균 처리량: 19.5 Gbps
- 지터(Jitter): 0.006 ms
- 패킷 손실률: 약 2.6% (19995/762929)
즉, 서버는 요청한 20Gbps 중 평균 19.5Gbps를 실제 수신하였고 패킷 손실은 소폭(2~4%) 구간적으로 발생했음을 알 수 있었습니다.
실습 - TCP 다중 스트림
[터미널1] iperf3-server pod 로그 모니터링
kubectl logs -l app=iperf3-server -f
[터미널2] iperf3 클라이언트 Pod에 접속하여 server로 통신
kubectl exec -it deploy/iperf3-client -- iperf3 -c iperf3-server -t 10 -P 2
위 명령어를 통해 10초 동안 2개의 병렬 TCP 스트림을 사용해 네트워크 성능을 측정해보겠습니다.

- 총 전송량: 133 GBytes
- 평균 처리량: 114 Gbits/sec
- 재전송(Retr): 170회
- 각 스트림당 약 57 Gbits/sec 처리량
- 재전송은 스트림 #5(59회), 스트림 #7(111회)
즉, 병렬 스트림 2개를 사용했을 때 총 처리량이 약 114 Gbits/sec 로 측정된 것으로 단일 스트림 대비 처리량이 선형적으로 늘어나는 것을 확인 할 수 있습니다. 다만 TCP 특성상 Cwnd와 네트워크 부하 영향으로 재전송이 170회 발생되었습니다.
Prometheus를 통해 지표 확인
rate(hubble_flows_processed_total{protocol="TCP", verdict="FORWARDED"}[1m])
TCP 프로토콜 중 정상적으로 전달된 트래픽을 hubble_flows_processed_total로 쿼리해보겠습니다.

위와 같이 graph를 확인할 수 있는데, 첫 실습으로 TCP 처리량이 급격히 증가했다가 마지막 실습으로 또 다시 급격히 증가한것을 확인할 수 있습니다.
sum by (protocol) (rate(hubble_flows_processed_total{verdict="FORWARDED"}[1m]))
위 쿼리는 iperf3 테스트로 인해 발생한 Pod 간 네트워크 트래픽의 플로우 수 변동을 TCP/UDP 프로토콜별로 보여줍니다.
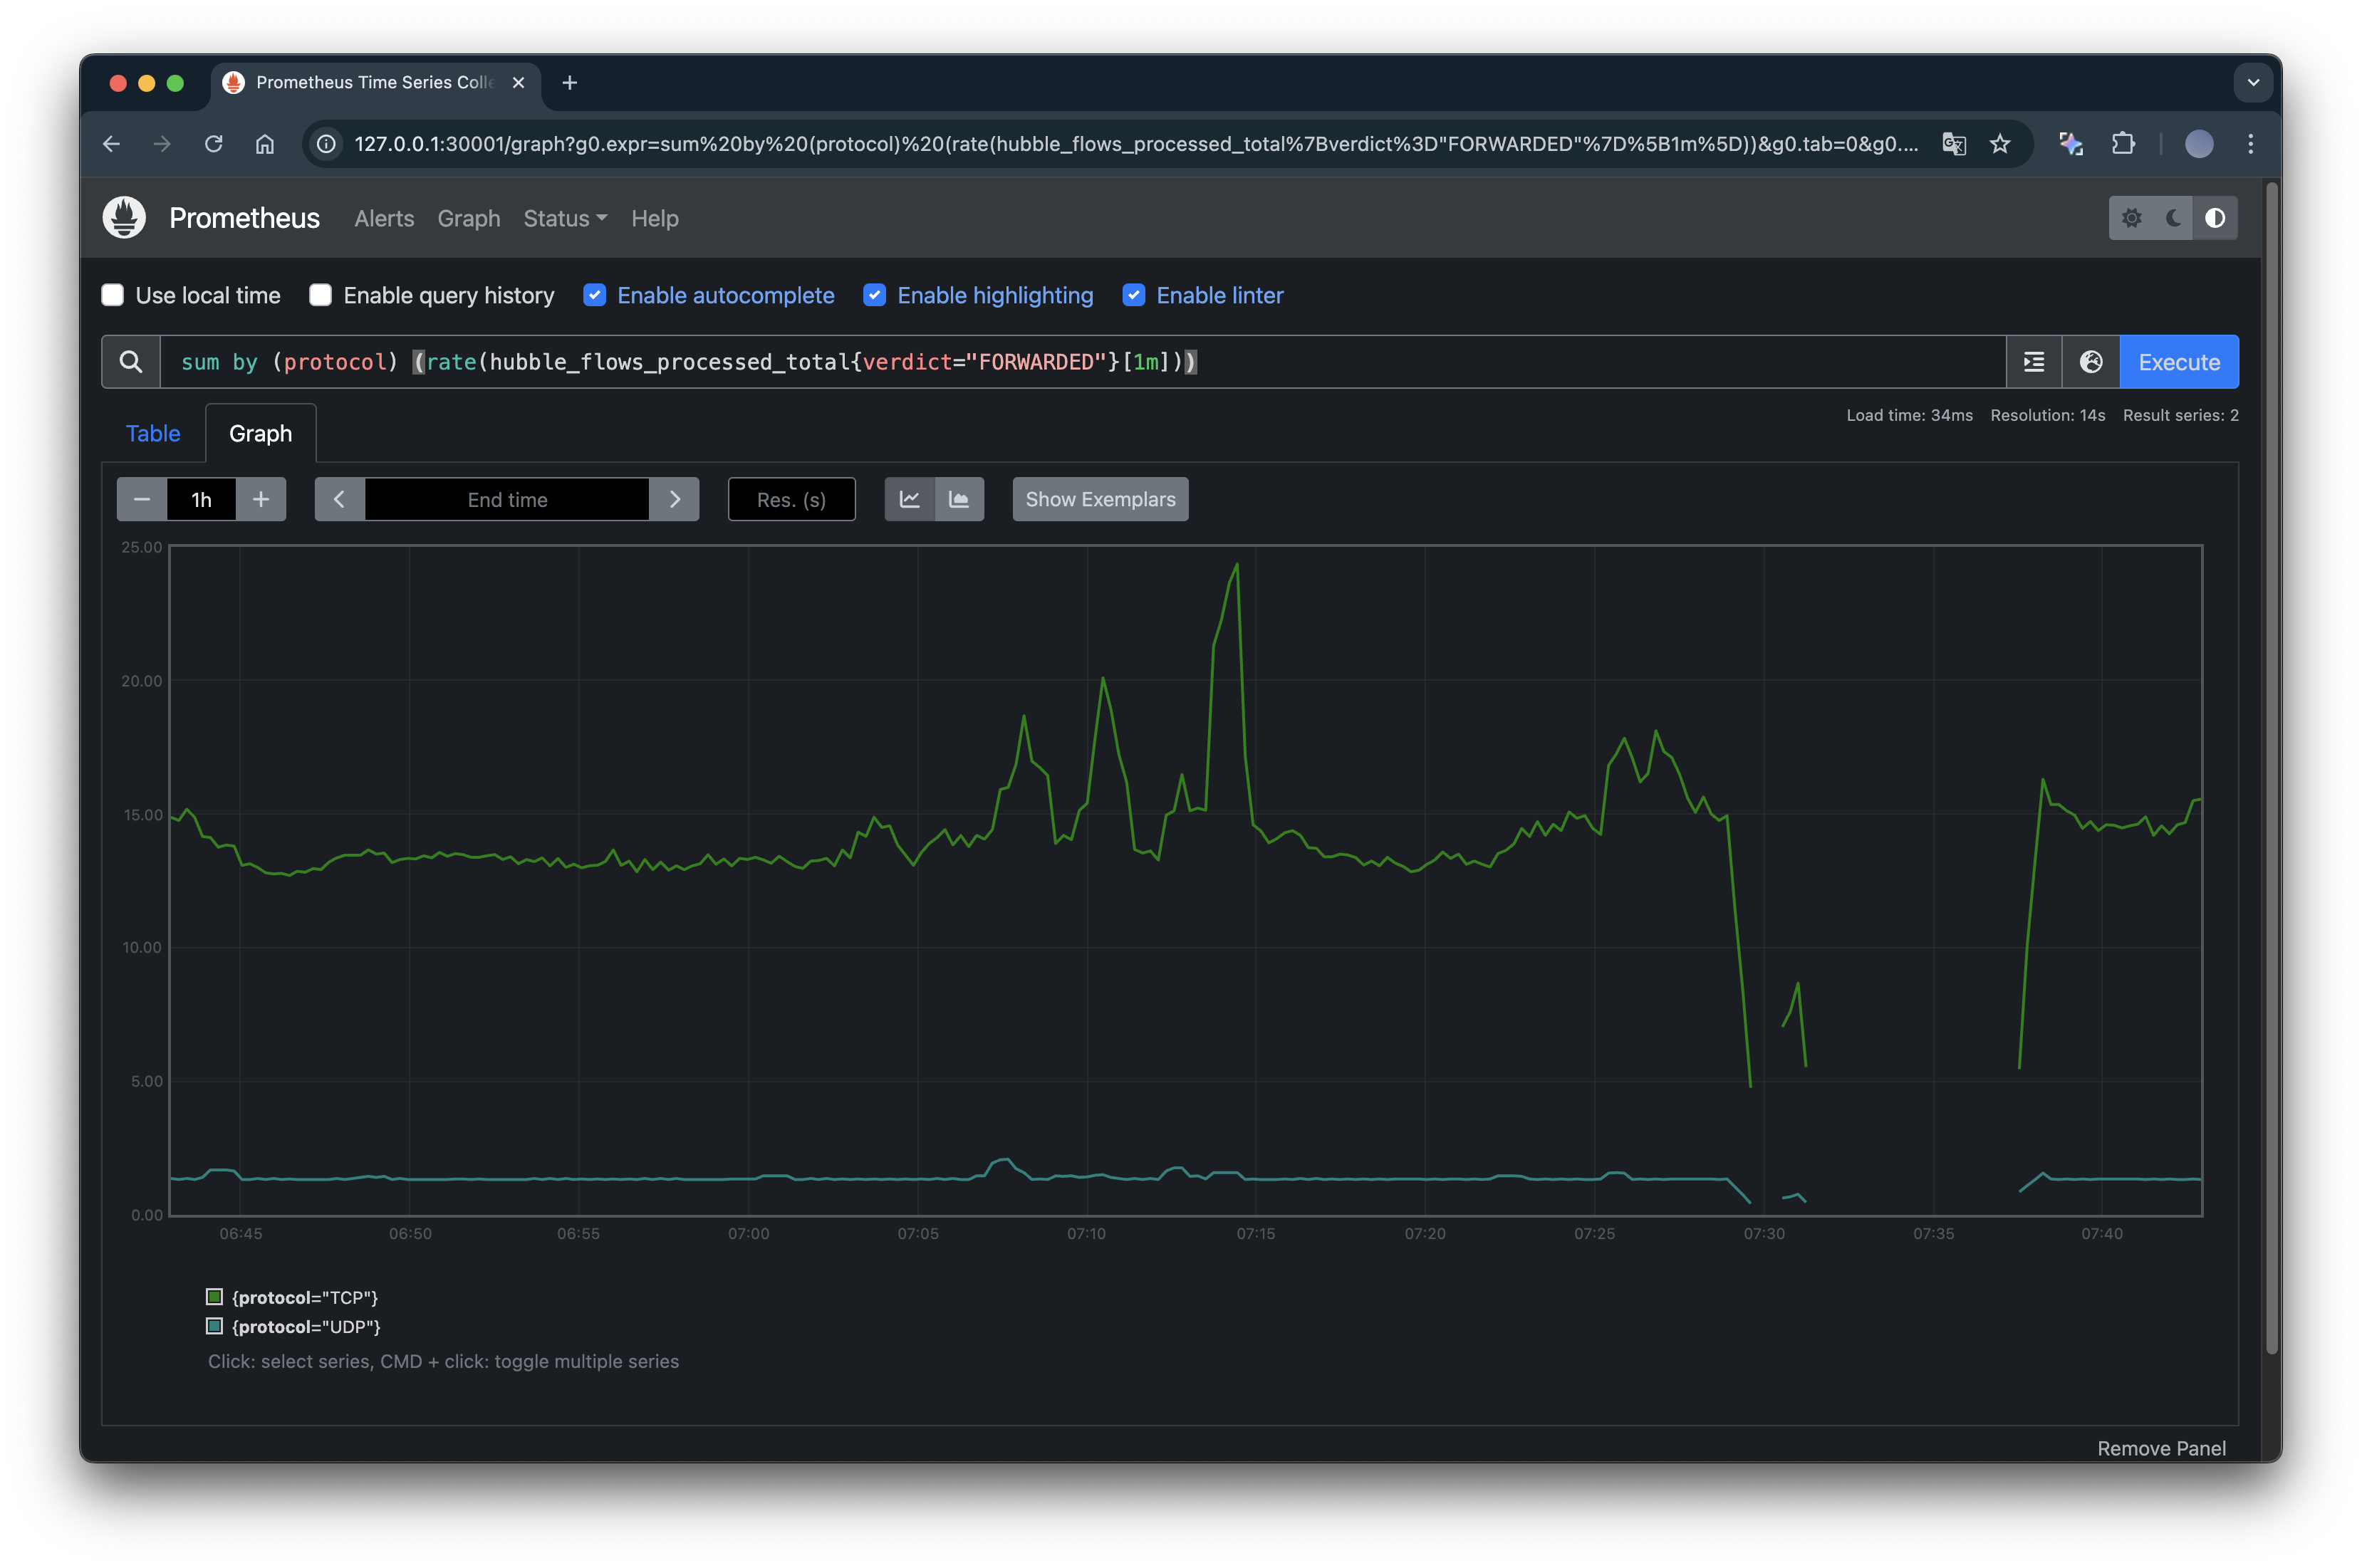
위 그래프를 토대로 TCP 부하 테스트 시 순간적으로 많은 세션/패킷 흐름이 발생했음을 알 수 있고, UDP 플로우는 TCP보다 훨씬 낮은 값으로 나타나기에 테스트가 짧게 수행되었고, 그 외에는 큰 트래픽이 없었음을 알 수 있습니다.
sum by (drop_reason) (
  rate(hubble_flows_processed_total{verdict="DROPPED"}[5m])
)
Hubble이 기록하는 네트워크 플로우 이벤트 중 허용되지 않고 차단된 트래픽만 집계해보는 쿼리를 확인해보겠습니다.
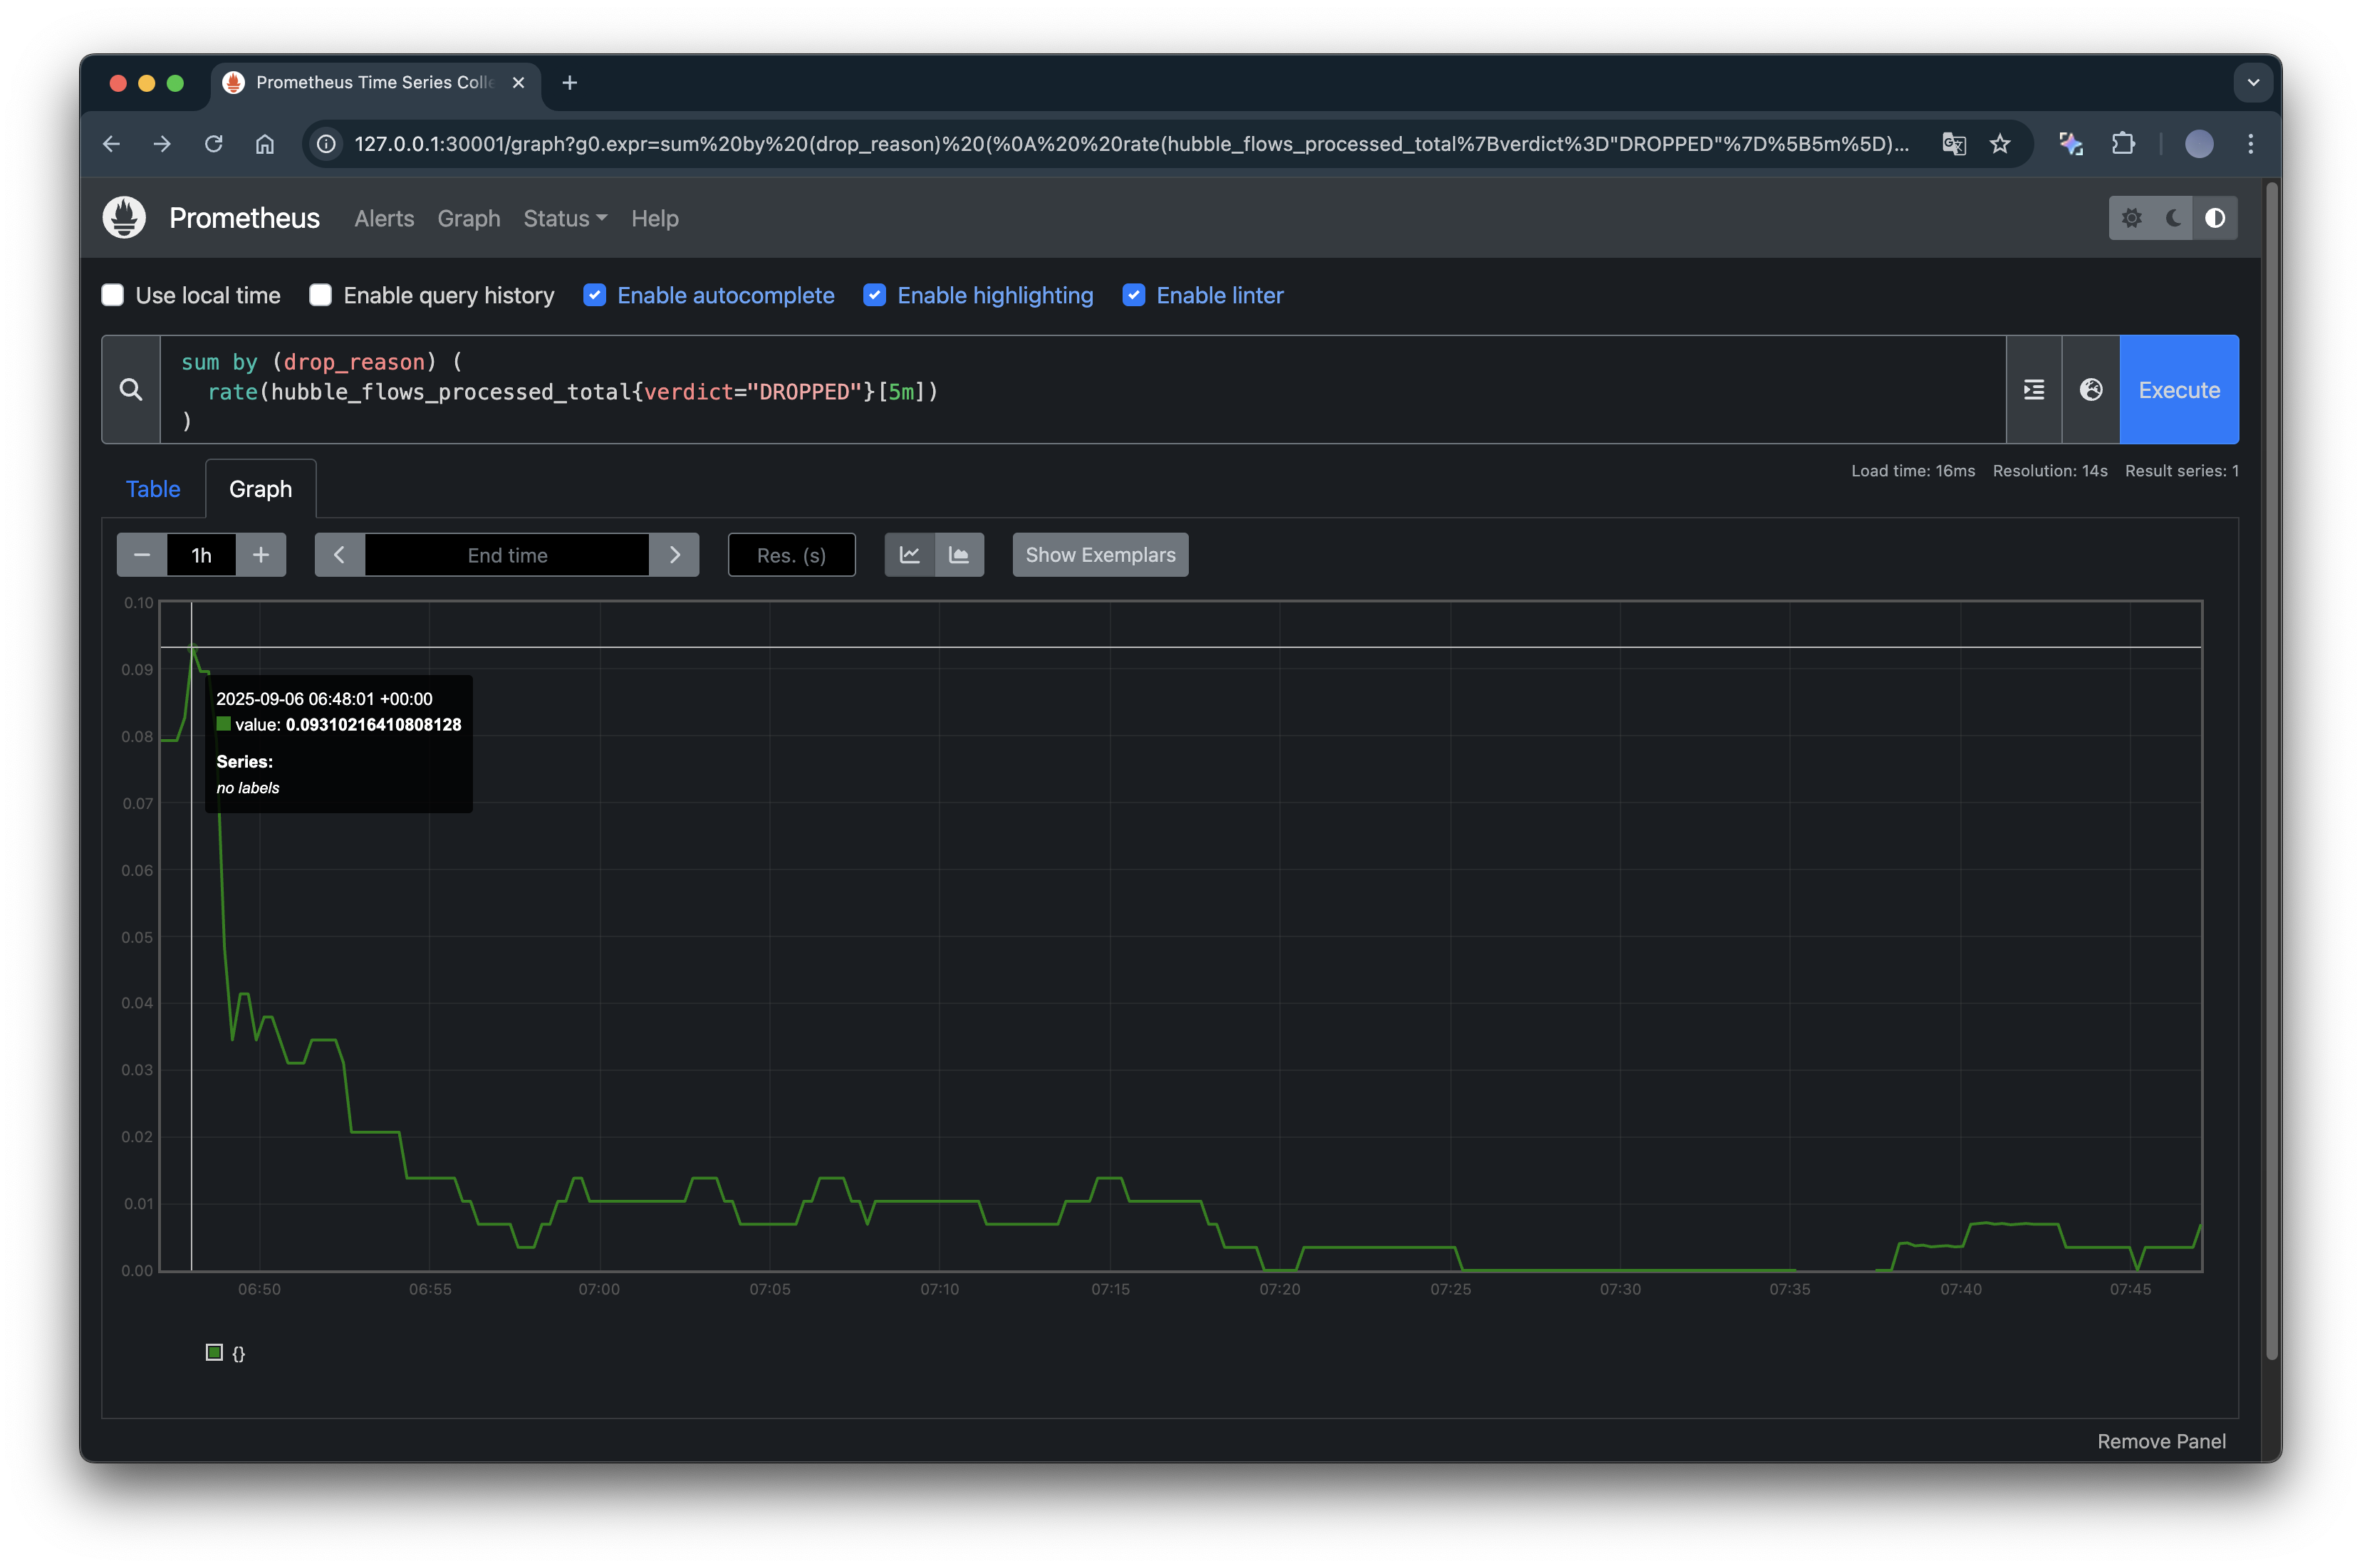
iperf3 테스트 초기에 드롭이 존재했으나, 시간이 지나면서 안정화되면서 거의 드롭이 사라진 것을 확인할 수 있습니다.