
Hubble

Hubble이란?
Hubble에 대한 내용은 이전의 포스팅한 내용으로 대체합니다.
Hubble은 클라우드 네이티브 워크로드를 위한 완전 분산형 네트워킹 및 보안 가시성 플랫폼입니다. Hubble은 오픈 소스 소프트웨어이며, Cilium과 eBPF 위에 구축되어 서비스 간의 통신과 동작뿐만 아니라 네트워킹 인프라에 대해 깊이 있는 가시성을 완전히 투명한 방식으로 제공 합니다.
요약하자면 Hubble은 Cilium의 eBPF 기반 datapath 위에서 동작하며, gRPC를 통해 수집된 L3~L7 네트워크 이벤트를 실시간으로 스트리밍하고, DNS, HTTP, gRPC 등 주요 프로토콜에 대한 가시성과 보안 분석을 가능하게 한다.
실습
Hubble 환경 구성

이전 글처럼 위와 같은 환경을 Vagrant와 VirtualBox를 활용하여 구성합니다.
설치
helm upgrade cilium cilium/cilium --namespace kube-system --reuse-values \
--set hubble.enabled=true \
--set hubble.relay.enabled=true \
--set hubble.ui.enabled=true \
--set hubble.ui.service.type=NodePort \
--set hubble.ui.service.nodePort=31234 \
--set hubble.export.static.enabled=true \
--set hubble.export.static.filePath=/var/run/cilium/hubble/events.log \
--set prometheus.enabled=true \
--set operator.prometheus.enabled=true \
--set hubble.metrics.enableOpenMetrics=true \
--set hubble.metrics.enabled="{dns,drop,tcp,flow,port-distribution,icmp,httpV2:exemplars=true;labelsContext=source_ip\,source_namespace\,source_workload\,destination_ip\,destination_namespace\,destination_workload\,traffic_direction}"
위 명령어를 통해 helm으로 hubble을 설치합니다.
Cilium, Hubble, and Cilium Operator는 기본적으로 메트릭을 노출하지 않기 때문에 Hubble 기능(UI, Relay, metric, export)과 Prometheus 메트릭 수집을 활성화하고, Hubble UI를 NodePort(31234)로 노출하게끔 옵션을 활성화합니다.
설치 확인
cilium status
cilium status 명령어를 통해 cilium 상태를 확인해보겠습니다.

Hubble Relay가 OK로 활성화 되어있고, hubble-relay, hubble-ui가 running 중인 것을 확인할 수 있습니다.
Hubble UI 접근
kubectl get svc -n kube-system hubble-ui
클러스터 내 네트워크 흐름을 시각적으로 실시간 모니터링 할 수 있도록 보여주는 hubble-ui에 접근해보기 위해 hubble-ui의 svc를 확인해보겠습니다.

현재 hubble-ui pod의 80 port에 31234 node port로 설정되어 있는 것을 확인할 수 있습니다.
NODEIP=$(ip -4 addr show eth1 | grep -oP '(?<=inet\s)\d+(\.\d+){3}')
echo -e "http://$NODEIP:31234"
node ip를 환경변수로 지정한 후 해당 node의 31234 port로 접근해보겠습니다.

그 후 kube-system namespace를 선택하면 위와 같이 모니터링 화면을 확인하실 수 있습니다.
샘플 애플리케이션 구성
Pod 배포
cat << EOF | kubectl apply -f -
apiVersion: apps/v1
kind: Deployment
metadata:
  name: webpod
spec:
  replicas: 2
  selector:
    matchLabels:
      app: webpod
  template:
    metadata:
      labels:
        app: webpod
    spec:
      affinity:
        podAntiAffinity:
          requiredDuringSchedulingIgnoredDuringExecution:
          - labelSelector:
              matchExpressions:
              - key: app
                operator: In
                values:
                - sample-app
            topologyKey: "kubernetes.io/hostname"
      containers:
      - name: webpod
        image: traefik/whoami
        ports:
        - containerPort: 80
---
apiVersion: v1
kind: Service
metadata:
  name: webpod
  labels:
    app: webpod
spec:
  selector:
    app: webpod
  ports:
  - protocol: TCP
    port: 80
    targetPort: 80
  type: ClusterIP
EOF
cat <<EOF | kubectl apply -f -
apiVersion: v1
kind: Pod
metadata:
  name: curl-pod
  labels:
    app: curl
spec:
  nodeName: k8s-ctr
  containers:
  - name: curl
    image: nicolaka/netshoot
    command: ["tail"]
    args: ["-f", "/dev/null"]
  terminationGracePeriodSeconds: 0
EOF
Pod 확인
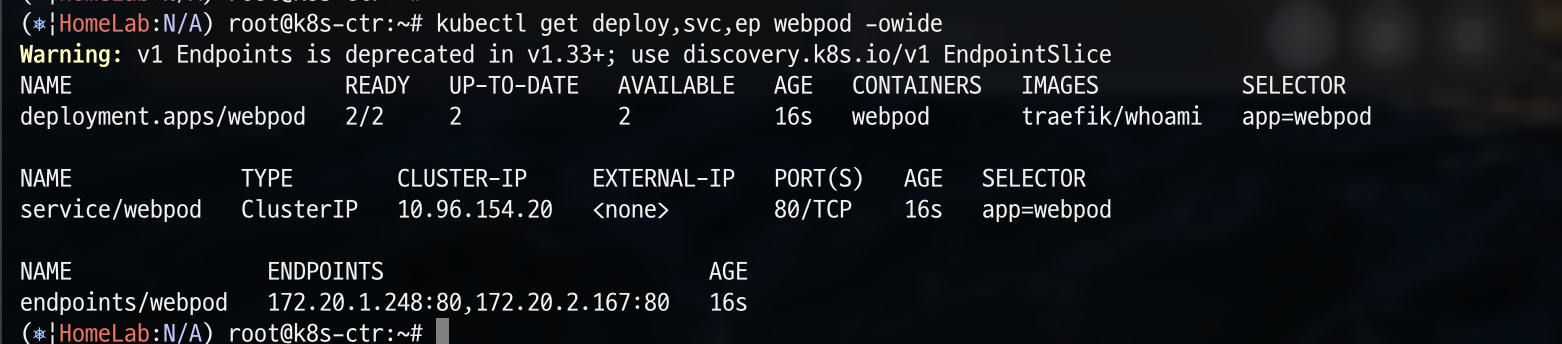
webpod라는 이름의 파드 2개가 클러스터 내에서 정상적으로 배포되었고, webpod service를 통해 ClusterIP인 10.96.154.20:80으로 접근 가능하도록 배포된 것을 확인할 수 있습니다.
Prometheus & Grafana 환경 구성
설치
kubectl apply -f https://raw.githubusercontent.com/cilium/cilium/1.17.6/examples/kubernetes/addons/prometheus/monitoring-example.yaml
확인
kubectl get deploy,pod,svc,ep -n cilium-monitoring
cilium-monitoring namespace의 deploy와 pod, service, endpoint를 확인해보겠습니다.

cilium-monitoring 네임스페이스에 Grafana와 Prometheus가 각각 1개씩 정상적으로 실행 중이며, service는 클러스터 내부에서 각각 포트 3000과 9090으로 접근 가능하고, 해당 서비스는 각 파드의 IP와 포트에 연결되어 있게 배포된 것을 확인할 수 있습니다.
hostPC에서 접속을 위한 NodePort 설정
kubectl get svc -n cilium-monitoring
현재 service를 확인해보면 아래와 같이 ClusterIP로 설정되어 있어 외부에서 접근할 수 없는 것을 알 수 있습니다.

kubectl patch svc -n cilium-monitoring prometheus -p '{"spec": {"type": "NodePort", "ports": [{"port": 9090, "targetPort": 9090, "nodePort": 30001}]}}'
kubectl patch svc -n cilium-monitoring grafana -p '{"spec": {"type": "NodePort", "ports": [{"port": 3000, "targetPort": 3000, "nodePort": 30002}]}}'
각각 30001, 30002 port로 nodeport 설정을 진행합니다.

30001 port 접근

30001 port로 접근하면 prometheu에 접근이 가능합니다.
30002 port 접근


30002 port로 접근하면 grafana에 접근이 가능합니다.
Monitoring 및 Metric 구성
metric 확인
kubectl describe pod -n kube-system -l k8s-app=cilium | grep prometheus
위에서 hubble을 설치할 때 prometheus도 활성화시켰기 때문에 cilium-agent의 metric이 어떻게 쌓이고 있는지 확인해보겠습니다.

현재 9962 port로 prometheus가 설정되어 있는 것을 확인할 수 있습니다.
echo -e "http://$NODEIP:9962/metrics"
위 경로로 접근해보겠습니다.
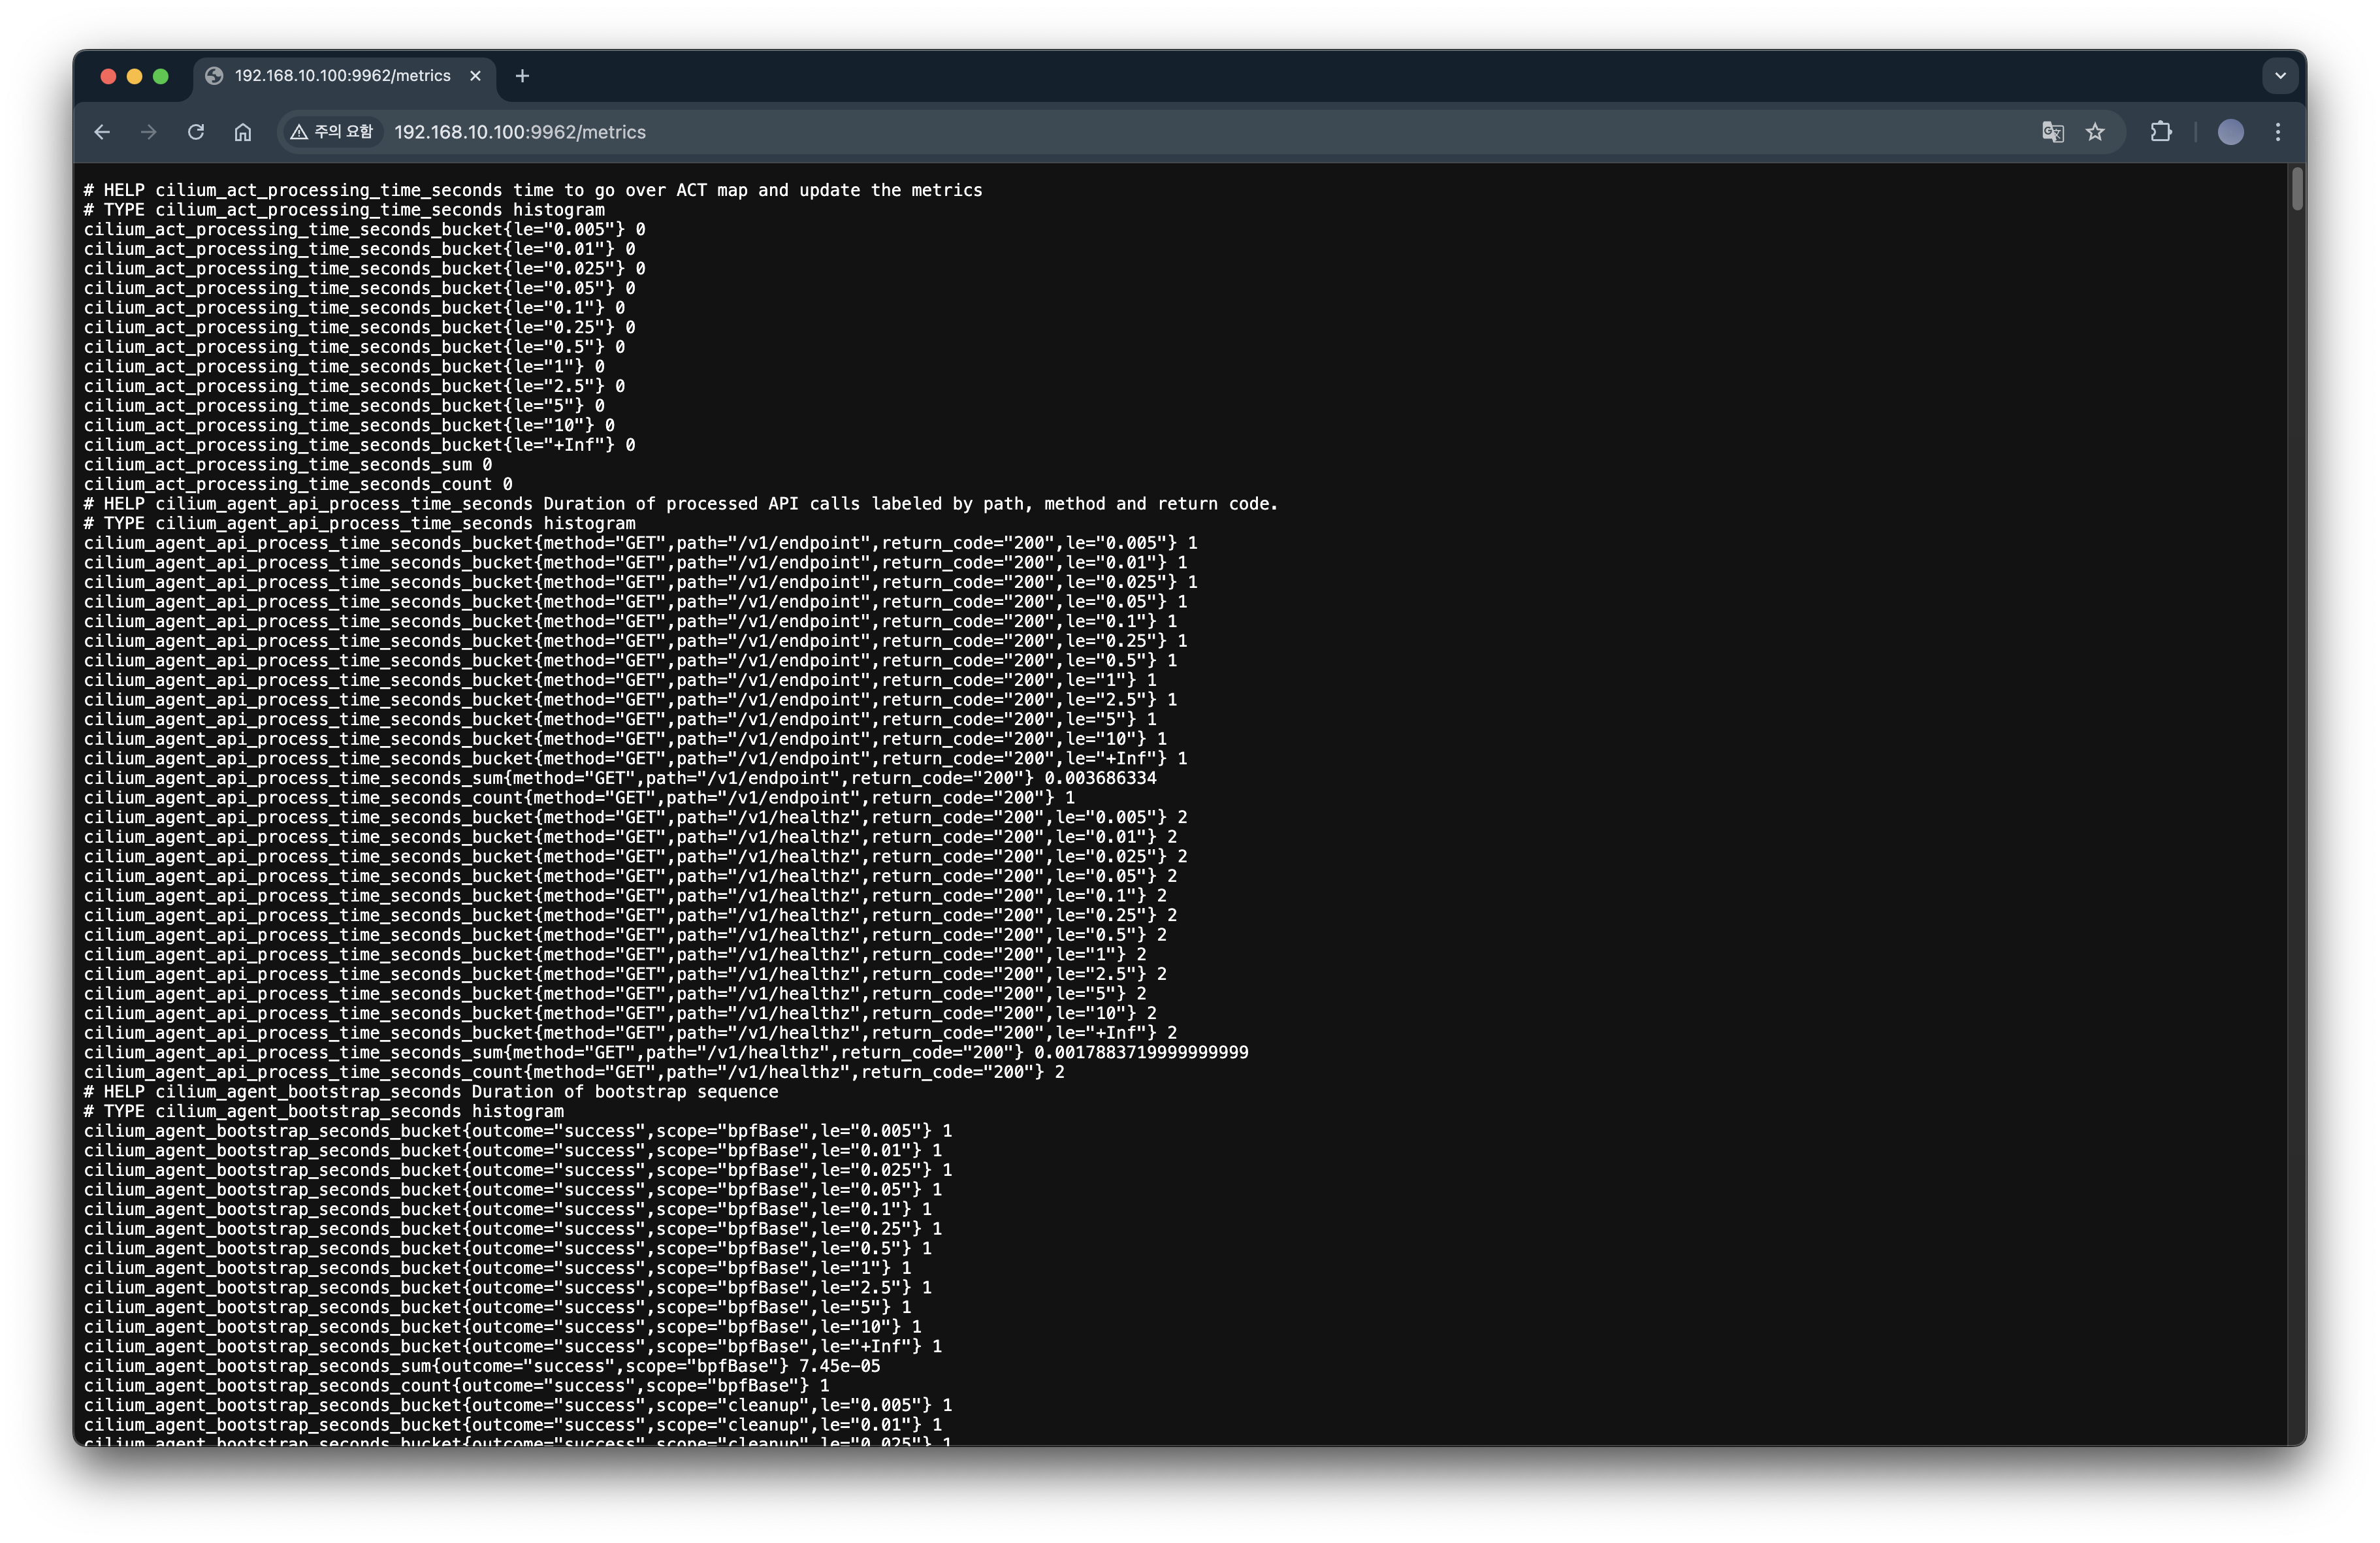
metric이 수집되고 있는 것을 확인할 수 있습니다.
kubectl describe pod -n kube-system -l name=cilium-operator | grep prometheus
추가로 cilium-operator의 metric도 확인해보겠습니다.

cilium-operator는 현재 9963 port로 prometheus가 설정되어 있는 것을 확인할 수 있습니다.
echo -e "http://$NODEIP:9963/metrics"

역시 metric이 수집되고 있는 것을 확인할 수 있습니다.
prometheus target 확인

이전에 설치한 prometheus에서 target을 확인해보면 cilium-operator와 daemonset으로 배포한 cilium-agent를 정상적으로 scrap하고 있는 것을 확인할 수 있습니다.

hubble도 마찬가지로 scape하고 있습니다.
Layer 7 Protocol Visibility
Cilium에서 기본 모니터링은 L3/L4 패킷에 대해서만 확인할 수 있습니다. 그렇기 때문에 L7 가시성을 위해서는 L7 규칙이 포함된 CiliumNetworkPolicy를 생성해야 하고, 이 정책은 트래픽 가시화뿐 아니라 제한 기능도 수행할 수 있습니다.
L7 CiliumNetworkPolicy 생성
cat <<EOF | kubectl apply -f -
apiVersion: "cilium.io/v2"
kind: CiliumNetworkPolicy
metadata:
  name: "l7-visibility"
spec:
  endpointSelector:
    matchLabels:
      "k8s:io.kubernetes.pod.namespace": default  # default 네임스페이스 안의 모든 Pod에 대해 egress 정책이 적용
  egress:
  - toPorts:
    - ports:
      - port: "53"
        protocol: ANY  # TCP, UDP 둘 다 허용
      rules:
        dns:
        - matchPattern: "*"  # 모든 도메인 조회 허용, L7 가시성 활성화
  - toEndpoints:
    - matchLabels:
        "k8s:io.kubernetes.pod.namespace": default
    toPorts:
    - ports:
      - port: "80"  # default 다른 파드의 HTTP TCP 80 요청 허용
        protocol: TCP
      - port: "8080"  # default 다른 파드의 HTTP TCP 8080 요청 허용
        protocol: TCP
      rules:
        http: [{}]  # 모든 HTTP 요청을 허용, L7 가시성 활성화
EOF
위 CiliumNetworkPolicy는 default 네임스페이스의 모든 pod에 대해 DNS 및 L7 트래픽에 대한 가시성을 활성화하고 제어하며, 이를 제외한 모든 egress 트래픽을 차단하도록 합니다.
cilium-envoy 경유 확인
kubectl exec -it curl-pod -- curl -s webpod
위 명령어를 통해 curl-pod에서 webpod 서비스로 HTTP 요청을 보내고 그 응답 내용을 확인해보겠습니다.

curl-pod에서 webpod 서비스로 HTTP 요청을 보냈고, 요청은 Envoy 프록시를 거쳐 webpod 파드에 도달했으며, 파드는 정상적으로 요청을 수신하고 응답했다는 것을 알 수 있습니다.
Hubble에서 확인

또한, Hubble UI에서 default 네임스페이스 내 curl → webpod 간의 HTTP 통신 흐름을 시각화하여 확인할 수 있으며 더욱 자세하게는 curl-pod에서 반복적으로 webpod으로 HTTP 요청이 발생하고 있으며, 요청은 Cilium 프록시(Envoy)를 통해 처리되고 있고, 일부 요청은 L7 계층에서 분석되어 HTTP 메서드(GET)로 호출하고 있다는 것을 알 수 있습니다.
매트릭 확인을 위해 반복 접속
kubectl exec -it curl-pod -- sh -c 'while true; do curl -s webpod | grep Hostname; sleep 1; done'
위 명령어로 반복 접근하도록 하여 metric을 수집한 다음 grafana에서 확인해보도록 하겠습니다.

Cilium Hubble의 L7 HTTP 메트릭을 시각화한 대시보드로 L7 메트릭까지 분석할 수 있습니다.
'스터디 이야기 > 25' Cilium' 카테고리의 다른 글
| Cilium Overlay Network 실습 (4) | 2025.08.06 |
|---|---|
| Cilium 환경에서 NodeLocal DNSCache 적용하기 (2) | 2025.07.30 |
| Cilium IPAM Mode와 IPAM 모드 변경 실습 (3) | 2025.07.28 |
| eBPF 기반 Cilium을 통한 K8s 네트워크 트래픽 분석 실습 (0) | 2025.07.19 |


